

- Report Index
- America at 250: Structural Transformations of the U.S. Economy (Part I)
- Economic Trends
-
2026.06
America at 250: Structural Transformations of the U.S. Economy (Part I)
~Long-Term Trends in Growth, Industrial Structure, Inequality, and Population~
Kazuma Maeda
- Executive Summary
-
- Except during the Great Depression beginning in 1929, the U.S. economy has maintained a long-term growth trajectory for more than two centuries. Supported by industrialization in the early twentieth century, the United States surpassed the United Kingdom in economic scale and has remained the world’s leading economic power for over 100 years.
- The manufacturing sector’s share of GDP continued to expand until the first half of the twentieth century. Thereafter, however, globalization and the rise of East Asian economies reduced the relative presence of the United States as an industrial power. At the same time, the ongoing shift toward a service-oriented economy supported substantial growth in finance and professional services over the past five decades.
- The share of income and wealth held by the top 1% declined from the Second World War through the 1970s. Since then, however, inequality in the United States has widened, reflecting factors such as lower unionization rates and reductions in top marginal income tax rates.
- Although the U.S. population has continued to increase, immigration has become a more significant driver of demographic growth since 2000. Restrictive immigration policies were implemented during the first half of the twentieth century, but the immigrant share of the population rose following the Immigration and Nationality Act of 1965 and has recently reached historically elevated levels.
On July 4, 2026, the United States will mark the 250th anniversary of its independence. This report series reviews structural changes in the U.S. economy from four perspectives: economic growth, industrial structure, inequality, and population. Part I summarizes long-term historical developments, while Part II examines the outlook for the next 50 years.
1. Economic Growth
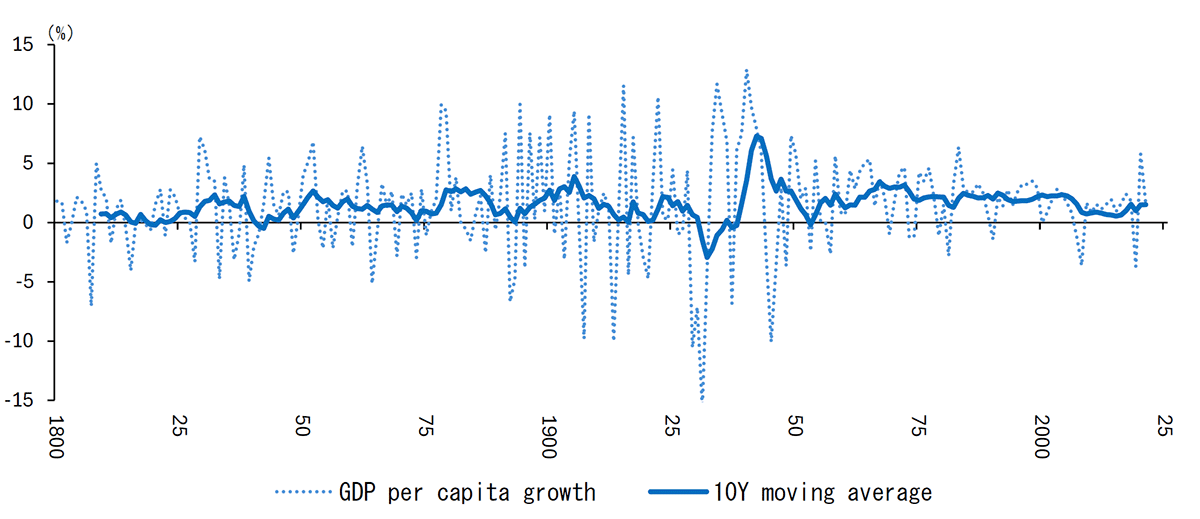
Figure 1 illustrates real GDP growth per capita in the United States since 1800. The U.S. economy has maintained a long-term growth trend for more than two centuries. Economic growth weakened for extended periods during crises such as the panics of 1837 and 1893, but the economy later recovered through the expansion of railroads and heavy industry in the nineteenth century and through the growth of the automobile, electricity, and electrical equipment industries in the early twentieth century.
The Great Depression beginning in 1929 dealt a severe blow to the U.S. economy. At the same time, fiscal expansion under the New Deal and wartime military production during the Second World War boosted headline growth. In the postwar period, growth became relatively stable, supported by population expansion including immigration, advances in information technology, financial market development, globalization, and improvements in macroeconomic policy management. Since the global financial crisis in 2008, however, the United States has experienced an extended period of subdued growth often described as “secular stagnation.”
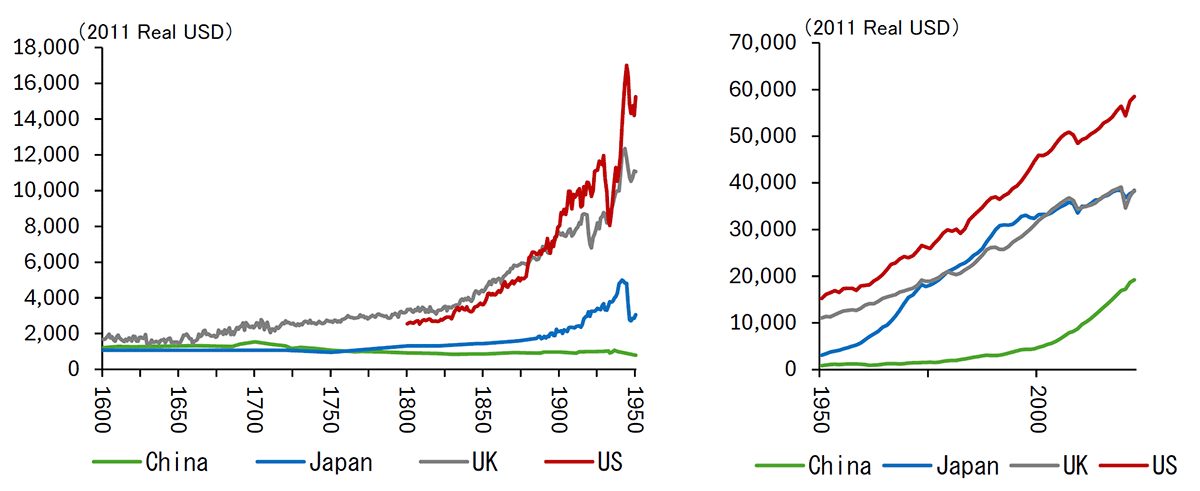
From an international perspective (Figure 2), the United States has maintained global economic leadership for more than a century. In terms of real GDP per capita, the United Kingdom was the dominant economy during the nineteenth century, while the United States experienced rapid economic expansion alongside industrialization in the early twentieth century. Japan approached U.S. income levels around 1990, but growth slowed sharply after the collapse of the asset bubble. China has achieved remarkable growth since 2000, although its per capita income level remains well below that of the United States.
Figure 1. U.S. Economic Growth
Source: Maddison Project.
Figure 2. International Comparison of Real GDP per Capita
Source: Maddison Project.
2. Industrial Structure
Figure 3 shows changes in the sectoral composition of U.S. GDP. In the first half of the nineteenth century, agriculture, centered on cotton plantations in the South, formed the core of the economy. During the latter half of the nineteenth century, heavy industries led by steel production expanded alongside the development of railroads and the enlargement of the domestic market. In the early twentieth century, Ford established mass automobile production, contributing to the spread of machinery-related industries. As a result, manufacturing accounted for more than 20% of GDP by the 1920s.
Although the United States retained its status as a major industrial economy from the Second World War through the 1960s, the economy subsequently shifted toward services. This transition reflected globalization driven by the rise of East Asian economies such as Japan and China, as well as the expansion of free trade. Meanwhile, as the manufacturing share of GDP declined, finance and professional and technical services strengthened their presence, supported by the advantages of U.S. financial markets anchored by the dollar’s role as the key international currency and by strong research and development capabilities.
Figure 3. Sectoral Shares of GDP
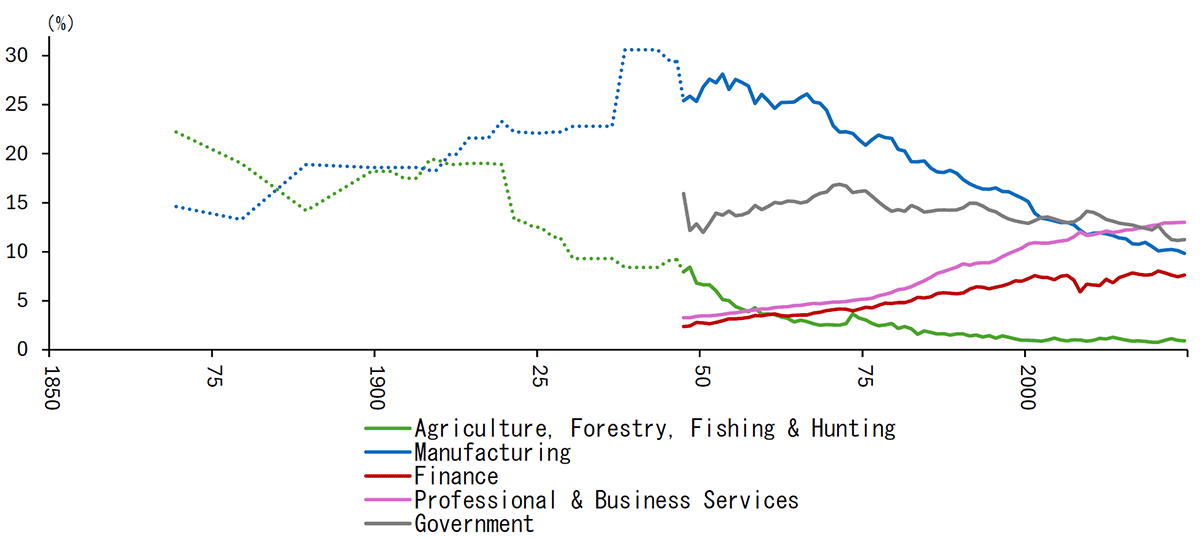
Note: Before 1946 (dotted lines), shares are based on national income data; from 1947 onward (solid lines), shares are based on value added. Source: The U.S. Census Bureau and the Bureau of Economic Analysis (BEA).
3. Inequality
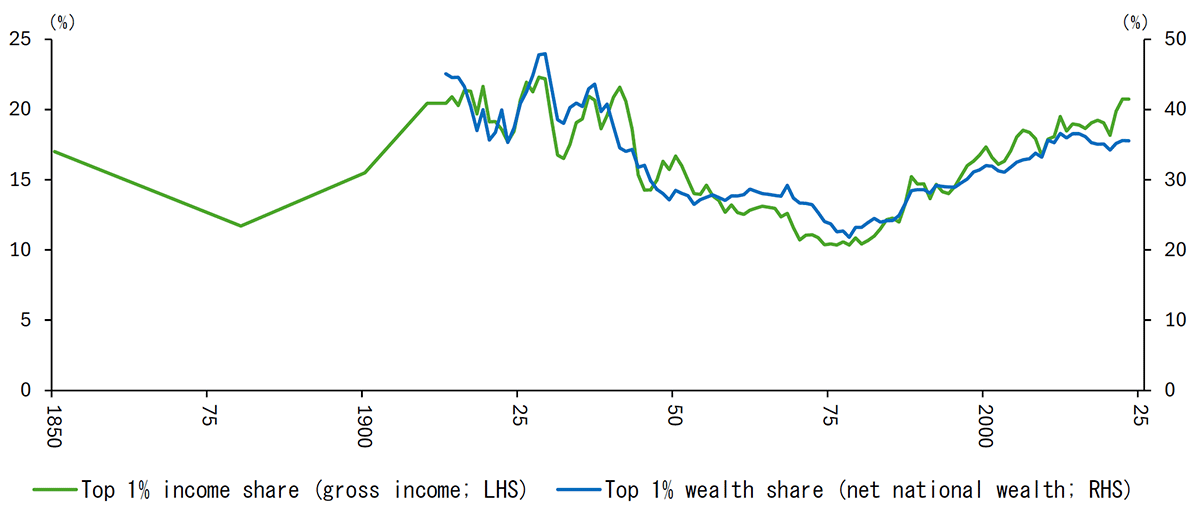
Figure 4 presents the share of income and wealth held by the top 1%. Economic inequality in the United States declined from the Second World War through the 1970s. Goldin and Margo (1992) described the wartime narrowing of the wage structure as “The Great Compression,” arguing that wartime demand for less-skilled labor and wage controls contributed to the narrowing of inequality. The reduction in inequality was subsequently sustained by factors including the expansion of higher education.
However, this trend reversed after 1980, and inequality has continued to widen to the present day. As the service sector expanded, unionization rates declined and workers’ bargaining power weakened relative to employers. In addition, the Reagan administration promoted broad-based tax reductions under supply-side economic policies, including cuts in the top marginal income tax rate.
Although Figure 4 shows inequality based on pre-tax income, lower income tax rates may also have strengthened incentives for corporate executives to seek higher compensation, thereby widening wage disparities between executives and workers.
Figure 4. Income and Wealth Shares of the Top 1%
Source: The Chartbook of Economic Inequality and Our World in Data.
4. Population
The U.S. population has expanded continuously since 1850. The total fertility rate, an important determinant of natural population growth, rose sharply during the postwar baby boom of the 1950s and 1960s, declined rapidly in the 1970s, and subsequently recovered modestly. Following the global financial crisis, however, fertility rates declined across racial groups during the 2010s.
Regarding this long-term decline in fertility, Kearney et al. (2022) argued that it is difficult to explain solely through specific policies or economic conditions, suggesting instead that changing social priorities regarding childbearing may have played a role.
Against this backdrop, immigration has become increasingly important as a driver of population growth in recent years. As of 2024, immigrants accounted for 15.0% of the U.S. population, the highest level since 1850. Looking at long-term trends, both the number and share of immigrants declined after 1930. Contributing factors included the national-origins quota system established under the Immigration Act of 1924, labor market weakness during the Great Depression, and the deportation of Mexican immigrants and repatriation of Mexican immigrants during the 1930s.
The Immigration and Nationality Act of 1965 abolished national-origin quotas and gave priority to family reunification and skilled immigrants, leading both the number of immigrants and their population share to rise again. More recently, concerns over increased unauthorized immigration during the Biden administration contributed to renewed debate over immigration policy, while the Trump administration has pursued stricter immigration controls.
Figure 5. U.S. Population Composition and Immigrant Share
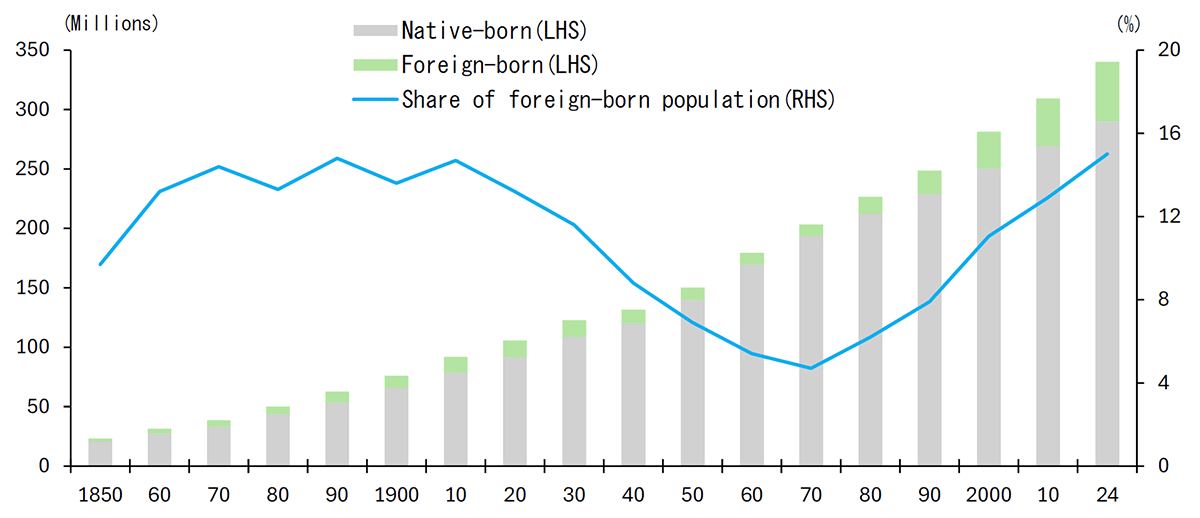
Source: The U.S. Census Bureau.
[References]
- Goldin, Claudia and Robert Margo (1992), “The Great Compression: The Wage Structure in the United States at Mid-Century,” The Quarterly Journal of Economics, Vol.107(1).
- Kearney, Melissa, Phillip Levine, and Luke Pardue (2022), “The Puzzle of Falling US Birth Rates since the Great Recession,” Journal of Economic Perspectives, Vol.36(1).
Original in Japanese:
https://www.dlri.co.jp/report/macro/598527.html
Disclaimer:
This report has been prepared for general information purposes only and is not intended to solicit investment. It is based on information that, at the time of preparation, was deemed credible by Daiichi Life Research Institute, but it accepts no responsibility for its accuracy or completeness. Forecasts are subject to change without notice. In addition, the information provided may not always be consistent with the investment policies, etc. of Daiichi Life or its affiliates.