

- Report Index
- America at 250: Structural Transformations of the U.S. Economy (Part Ⅱ)
- Economic Trends
-
2026.06
America at 250: Structural Transformations of the U.S. Economy (Part Ⅱ)
~Outlook Toward the 300th Anniversary of Independence~
Kazuma Maeda
- Executive Summary
-
- The United States is unlikely to lose its economic competitive advantage easily. According to the OECD’s long-term projections, U.S. GDP is expected to remain larger than China’s over the next 50 years, allowing the United States to retain its position as the world’s largest economy.
- Although the Trump administration seeks to revive domestic manufacturing through higher tariffs, significant challenges remain for large-scale reshoring, including elevated production costs and labor shortages. Given the continued shift in demand from goods toward services, industries such as information technology and finance are likely to remain the core of the U.S. economy.
- Public support for policies addressing inequality has increased gradually, but major policy changes over the past three decades have been limited. Younger generations, however, show stronger support for redistribution than older cohorts. If these preferences spread more broadly across society over time, the United States could eventually adopt a more active approach toward inequality reduction.
- U.S. fertility rates continue to decline, and natural population growth—defined as births minus deaths—is projected to turn negative around 2030. If restrictive attitudes toward immigration persist and population growth remains negative, the possibility of China overtaking the United States in GDP around 2040 could become increasingly plausible.
On July 4, 2026, the United States will celebrate the 250th anniversary of its independence. This report series examines structural changes in the U.S. economy from four perspectives: economic growth, industrial structure, inequality, and population. Building on the historical review presented in Part I, this report discusses key issues shaping the U.S. economy toward the nation’s 300th anniversary in 2076.
1. Economic Growth
Supported by industrialization in the early twentieth century, the United States surpassed the United Kingdom in economic scale and has maintained global economic leadership for more than a century. Since the beginning of the twenty-first century, however, China has rapidly expanded its economy through export growth and emerged as a major challenger to U.S. economic dominance.
Over the medium to long term, the size of an economy depends largely on growth in per capita GDP and population. In turn, growth in per capita GDP is influenced by factors such as technological progress and institutional quality.
The International Institute for Management Development (IMD) publishes a World Competitiveness Ranking based on four categories: economic performance, government efficiency, business efficiency, and infrastructure. In the 2025 ranking, the United States placed 13th overall and was assessed as globally competitive particularly in international investment, finance, and scientific infrastructure. While several higher-ranked economies—including Switzerland, Singapore, and Denmark—are relatively small countries with populations below 10 million, the United States remains among the most competitive large economies. China ranked 16th, Germany 19th, Japan 35th, and India 41st. The United States also ranked first in Stanford University’s Global AI Vibrancy Ranking in 2024, maintaining a substantial lead over second-place China.
The United States’ strong economic competitiveness is unlikely to erode quickly. In addition to hosting globally dominant firms in sectors such as technology and finance, the U.S. market remains indispensable for multinational corporations. Even when administrative inefficiencies exist relative to other countries, withdrawing from or avoiding the U.S. market would imply forfeiting substantial profit opportunities. Moreover, although political transitions have recently increased policy uncertainty, particularly regarding areas such as environmental regulation, policy frameworks at the state level remain comparatively stable and diverse, partially mitigating these risks. From the perspective of political and regulatory intervention, many non-Chinese global firms are likely to perceive China’s political environment as less predictable than that of the United States.
Figure 1 presents the OECD’s long-term GDP projections for major economies based on their shares of G20 GDP at market exchange rates. China’s economy is projected to approach the scale of the United States by around 2050, but the gap is expected to widen again thereafter due to aging and population decline in China. As a result, the United States is projected to remain the world’s largest economy over the next 50 years. Notably, during the 2010s, many forecasts anticipated that China would surpass the United States by the late 2020s, but slower Chinese growth in recent years has reduced the prevalence of such expectations.
Nevertheless, these long-term projections involve considerable uncertainty. For example, if the technological gap between the United States and China widens significantly—particularly in areas such as artificial intelligence—the U.S. growth outlook could either strengthen further or weaken relative to China depending on technological leadership.
One key concern is the long-term impact of immigration restrictions. If tighter immigration controls under the Trump administration persist and inflows of highly skilled foreign workers slow, innovation and research capacity could weaken, reducing potential growth. Bernstein et al. (2022) estimated that immigrants account for 16.5% of inventors in the United States, while patents generated by immigrant inventors represent 25.2% of total patent market value. Including collaborations with U.S.-born researchers, immigrants are involved in 36% of patents overall, particularly in rapidly evolving sectors such as information technology and healthcare.
Figure 1. Long-Term GDP Projections for Major Economies (Share of G20 GDP)
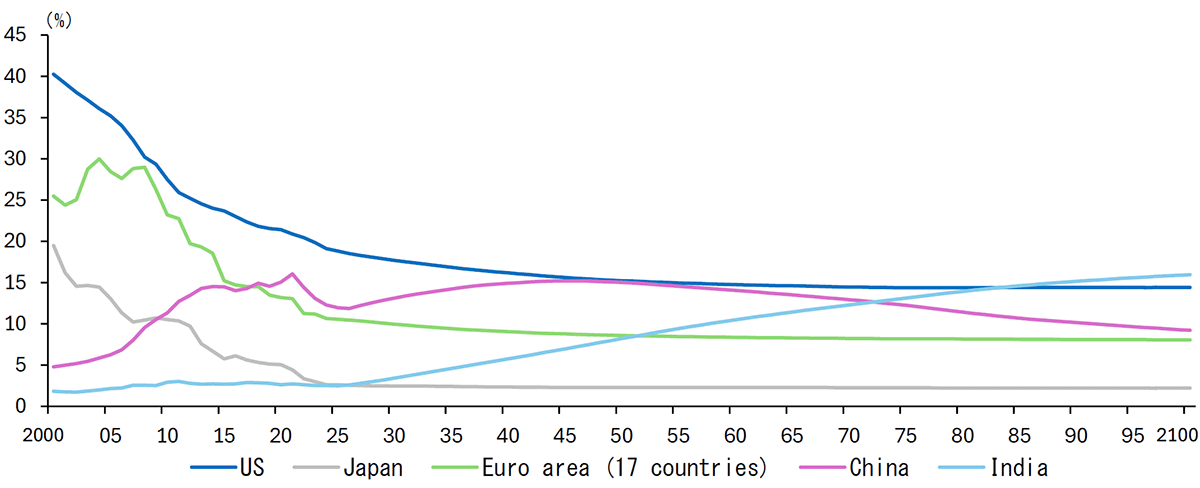
Source: OECD.
2. Industrial Structure
The manufacturing sector’s share of GDP expanded steadily until the first half of the twentieth century, but globalization and the rise of East Asian economies subsequently reduced the relative importance of the United States as an industrial power. Meanwhile, finance and professional services have grown substantially during the past five decades as the economy became increasingly service-oriented.
Under its “America First” agenda, the Trump administration has promoted the reshoring of manufacturing production. In 2025, the average effective U.S. tariff rate—measured as tariff revenue divided by imports—rose to its highest level since 1947 following broad tariff increases. Concerns also remain that elevated tariffs could persist even after the Trump administration, suggesting that the postwar trend toward freer trade may be reversing.
Tariffs can raise import prices and improve the competitiveness of domestic production. Even so, it remains difficult to envision a return to the manufacturing dominance seen before the 1970s. Service industries such as information technology and finance are therefore likely to remain the central pillars of the U.S. economy.
First, production costs in the United States remain comparatively high. Unless products are highly automated and high value-added, firms are unlikely to relocate production back to the United States. IMF projections for 2026 show that per capita GDP in Germany is equivalent to 69.2% of the U.S. level, while Japan stands at 37.8%, China at 15.7%, and India at 3.0%. Even accounting for higher import costs due to tariffs, imports from lower-cost emerging economies remain economically rational.
Figure 2. U.S. Average Effective Tariff Rate
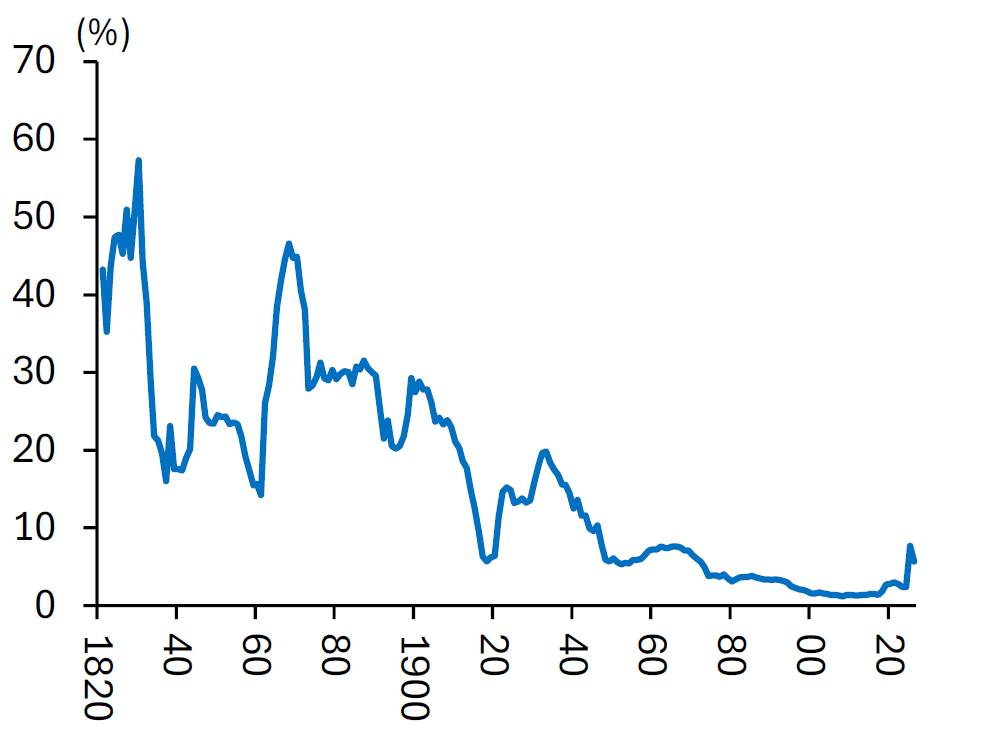
Figure 3. Shares of Goods and Services in U.S. Private Demand
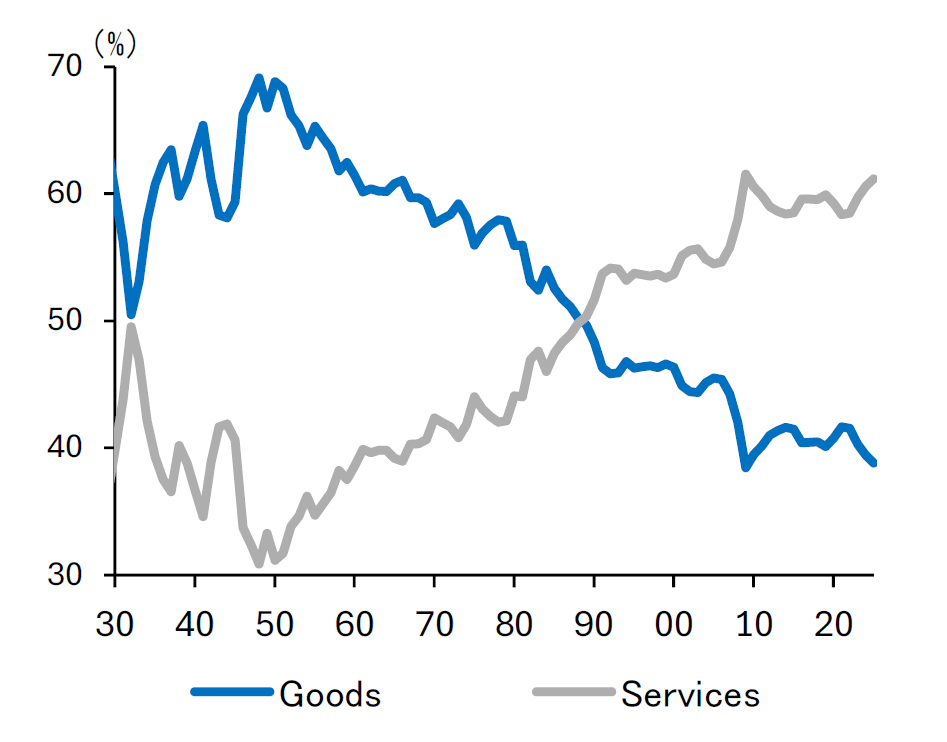
Source: Tax Foundation and the Bureau of Economic Analysis.
Labor supply also presents a challenge. According to a 2024 Cato Institute/YouGov survey, 80% of Americans agreed that the country would benefit if more people worked in manufacturing. However, among non-retired respondents not employed in manufacturing, only 25% said they would personally prefer factory employment to their current job. This suggests that labor shortages could become a significant obstacle to large-scale reshoring.
In addition, the manufacturing share of GDP declined from 22.9% in 1970 to 9.4% in 2025, reflecting not only changes in industrial competitiveness but also a structural shift in demand from goods toward services. During the 1970s, goods accounted for nearly 60% of private demand, but services surpassed goods in 1989 and currently account for 61% of private demand. Given the much stronger domestic demand for services relative to goods, a sharp resurgence in manufacturing appears unlikely.
3. Inequality
Although the share of income and wealth held by the top 1% declined from the Second World War through the 1970s, inequality has widened steadily since then. As of 2023, the top 1% accounted for 20.7% of pre-tax income and 35.5% of net wealth in the United States.
There is concern that the spread of generative AI could further accelerate inequality. Manning (2024), for example, argued that AI-driven productivity gains may disproportionately benefit highly skilled and high-income workers. In addition, the labor share of income in the United States has continued to decline since the 2000s amid globalization and the rise of large technology firms often referred to as “superstar companies.” Labor substitution through AI-driven automation could raise returns to capital and accelerate this decline further.
At the same time, political momentum for redistribution policies remains limited. The top marginal personal income tax rate was sharply reduced under the Reagan administration, and although some partial reversals occurred under Democratic administrations, the rate has generally remained below 40% over the past three decades. The Gini coefficient has also trended upward since the 1980s and remains elevated.
Public support for government action to reduce inequality has increased modestly. According to the General Social Survey conducted by NORC at the University of Chicago, the share of respondents agreeing that government should reduce income inequality has risen since the global financial crisis. Even so, views on redistribution remain strongly polarized along partisan lines. Republican voters generally accept income inequality arising from differences in effort and ability, provided equality of opportunity is maintained. Democratic voters, by contrast, express greater concern about individuals unable to maintain a minimum standard of living.
A 2022 Pew Research Center survey also found that among individuals aged 18–29, 44% viewed socialism favorably, exceeding the 40% who viewed capitalism positively. This may reflect growing dissatisfaction among younger generations regarding affordability, including student debt burdens and rising housing costs. Younger cohorts also benefit less from asset price appreciation than older generations, who hold larger financial assets. By contrast, Americans aged 65 and older—many of whom experienced the Cold War era—remain the most supportive of capitalism. As such, skepticism toward capitalism has not yet spread uniformly across generations.
Taken together, future structural changes such as the expansion of AI may increase inequality further, but broad public support for aggressive redistribution policies is unlikely to emerge in the near term. Over the longer term, however, younger generations that are relatively more supportive of redistribution may become politically dominant. If demands for stronger inequality measures spread across broader segments of the electorate, political support for redistribution could strengthen gradually over coming decades.
Figure 4. Top Marginal Personal Income Tax Rate
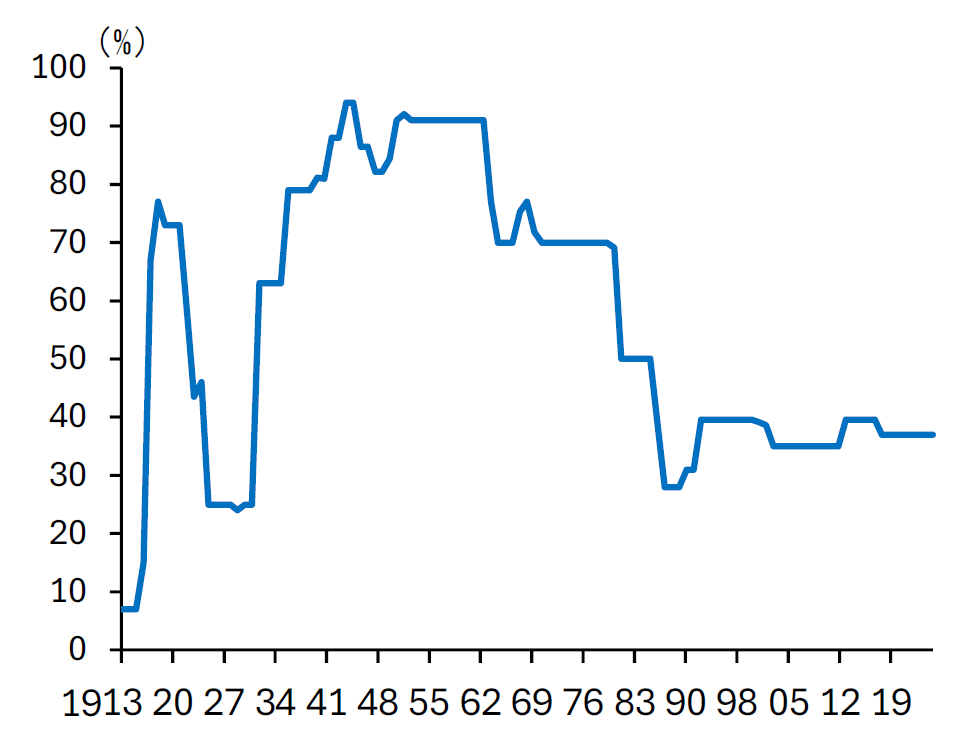
Figure 5. Public Views on Government Measures to Reduce Income Inequality
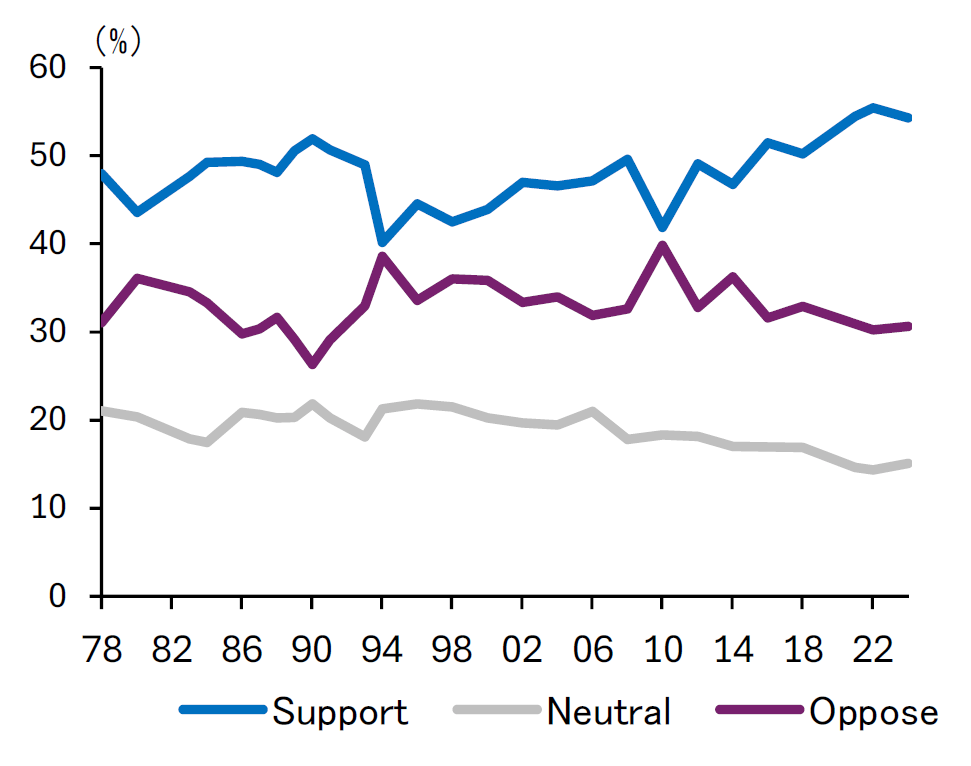
Note: In the General Social Survey, respondents are asked: “Think of a score of 1 as meaning that the government ought to reduce the income differences between rich and poor, and a score of 7 meaning that the government should not concern itself with reducing income differences. What score between 1 and 7 comes closest to the way you feel?” In Figure 5, responses 1–3 are classified as “Support,” 4 as “Neutral,” and 5–7 as “Oppose.”
Source: General Social Survey.
4. Population
Since the twentieth century, the U.S. population has expanded more rapidly than that of most advanced economies. High fertility during the baby boom period and active immigration inflows since the 1970s supported this population growth.
However, fertility rates in the United States have recently weakened in line with trends observed across other advanced economies. According to Congressional Budget Office (CBO) estimates released in January 2026, natural population growth—births minus deaths—is projected to turn negative around 2030. The CBO’s 2024 projection had previously expected this shift around 2040, suggesting that recent declines in fertility have persisted more strongly than anticipated.
Without substantial immigration inflows or effective measures to address declining birth rates, the U.S. population could begin shrinking during the 2030s. While population decline is not currently the baseline scenario in most forecasts, the possibility would become increasingly realistic if restrictive immigration policies remain in place over the medium to long term.
Notably, the OECD’s long-term GDP projections assume that the U.S. population will increase by roughly 53 million people over the next 50 years, rising from 342 million in 2026 to 395 million in 2076. If the U.S. population instead enters a gradual decline and per capita GDP growth fails to offset that demographic drag, the possibility of China overtaking the United States in GDP around 2040 cannot be ruled out.
Figure 6. U.S. Population Projections
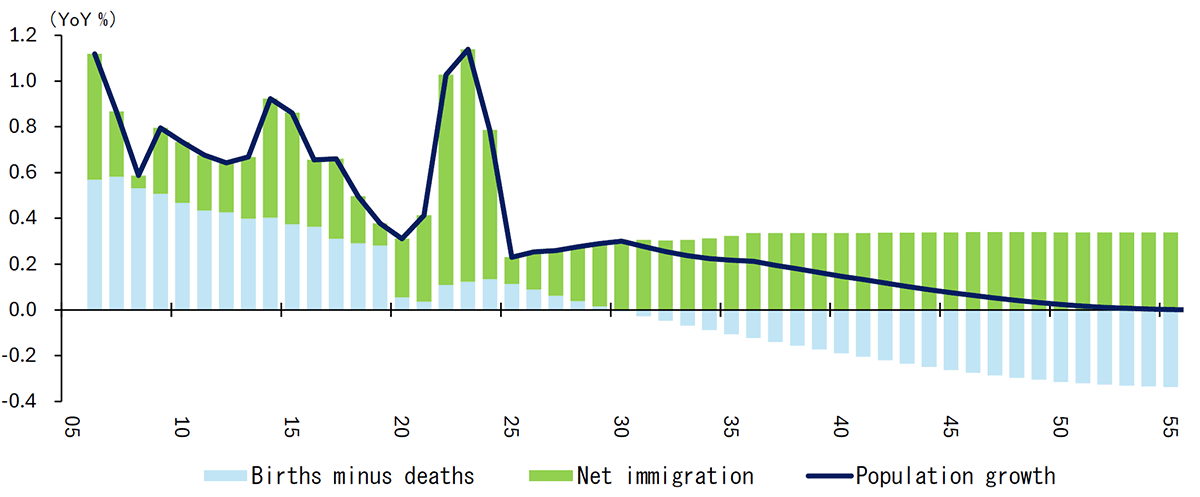
Source: Congressional Budget Office.
[References]
- Bernstein, Shai, Rebecca Diamond, Abhisit Jiranaphawiboon, Timothy McQuade, and Beatriz Pousada (2022), “The Contribution of High-Skilled Immigrants to Innovation in the United States,” NBER Working Paper Series, No.30797.
- Grabow, Colin (2024), “Americans Think Increased Manufacturing Employment Would Be Good for the Country but Not for Themselves,” Cato at Liberty.
- Manning, Sam (2024), “AI’s Impact on Income Inequality in the US,” Brookings Institution Commentary.
- Pew Research Center (2022), “Modest Declines in Positive Views of ‘Socialism’ and ‘Capitalism’ in U.S.”
Original in Japanese:
https://www.dlri.co.jp/report/macro/607072.html
Disclaimer:
This report has been prepared for general information purposes only and is not intended to solicit investment. It is based on information that, at the time of preparation, was deemed credible by Daiichi Life Research Institute, but it accepts no responsibility for its accuracy or completeness. Forecasts are subject to change without notice. In addition, the information provided may not always be consistent with the investment policies, etc. of Daiichi Life or its affiliates.