

- Report Index
- The Fragmentation of the Global Economy: Migration, Trade, and FDI Reshaping the World?
- Economic Trends
-
2024.10
The Fragmentation of the Global Economy: Migration, Trade, and FDI Reshaping the World?
Takuya HOSHINO, Kenichiro AHARA, Kazuma MAEDA
- Executive Summary
-
- The "fragmentation" of the global economy has been a persistent theme. This report analyzes how this fragmentation has unfolded amidst the US-China conflict and various global disputes. It clarifies the current state using data analysis from three perspectives of the economic constituents: "people" (immigration), "goods" (trade), and "capital" (investment).
- Examining various data, we observe a strong influence of the recent US-China decoupling on "people," "goods," and "capital." Conversely, there are also mitigating factors. These include a clear recovery trend in global permanent immigration. Additionally, as US-China trade and direct investment decrease, Global South countries are stepping in as substitutes and complements, thereby mitigating fragmentation.
- Characteristics of the current state of fragmentation include diversification and redundancy in supply chains. We are also seeing a reassessment of immigration policies in some countries and regions, along with direct investment regulations targeting specific countries and industries. The crucial question going forward is whether this economic fragmentation will advance to the next stage. Should it develop into a full-fledged division between free and non-free economies, or economic blocs, the repercussions for the global economy will be significantly more severe.
We will accept press inquiries and interviews. Please contact hoshino@dlri.co.jp
1. Introduction
The "fragmentation of the global economy" has become a critical topic in macroeconomic considerations. With the escalating US-China rivalry, the Russia-Ukraine war, and the Israel-Middle East conflict, various geopolitical risks have become prominent globally. These risks not only impact financial markets but also global supply chains. Politically, we see a rise of right-wing parties campaigning on anti-immigration platforms. In the US, former President Donald Trump, advocating for "America First" policies, is seeking re-election in the 2024 presidential race. Similarly, right-wing parties are notably gaining ground in European nations like France, Italy, and Germany.
While the significant shifts in global circumstances are reflected in daily news, much of the available information, albeit plentiful, remains fragmented and country or industry-specific. A comprehensive analysis of the entire global economy from a macro perspective appears to be lacking. This report seeks to address this gap by using data analysis to reveal how the fragmentation of the global economy is unfolding on a macro level, aiming to present a higher-resolution picture of this phenomenon. Our analysis will examine the current state from the perspectives of the three core elements of the economy: "people," "goods," and "capital," specifically analyzing "international migration," "trade transactions," and "foreign direct investment (FDI)" respectively.
2. Macroeconomic Impacts of Global Economic Fragmentation
First, let's qualitatively organize how "global economic fragmentation" potentially impacts macroeconomics. Theoretically, a deeper fragmentation of economic blocs would negatively pressure economic growth by making production systems inefficient. This, in turn, could lead to a decline in the global economy's supply capacity, constricting supply and demand and potentially increasing inflation.
Fragmentation also hinders the flow of production resources between countries with surpluses and those with deficits. For instance, implementing immigration restrictions prevents the movement of labor from labor-surplus to labor-shortage nations, further exacerbating the imbalance. This discrepancy can lead to downward pressure on wages in surplus countries and upward pressure in deficit countries through the loosening/tightening of labor supply and demand, potentially resulting in a bipolarization of inflation rates. The recent rise in deflation concerns surrounding China could be rooted in this phenomenon, with the US-China decoupling exacerbating China's oversupply.
Figure 1. What are the Macroeconomic Impacts of Global Economic Fragmentation?

(Source) Dai-ichi Life Research Institute.
In fact, a similar trend was observed during the Cold War era, with global inflation rates exhibiting both an overall average increase and a bipolarization between high-inflation and low-inflation countries.
Figure 2. Global Inflation Rates Before and After the End of the Cold War
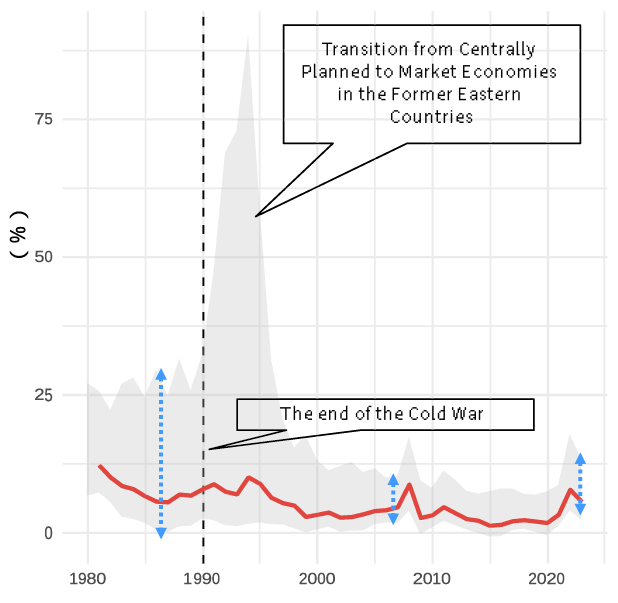
(Note) The grey band represents the maximum and minimum values of inflation rates after excluding the top and bottom 10% of countries. The spike in maximum inflation right after the end of the Cold War (early 1990s) can be attributed to the rapid shift towards market economies in former Eastern Bloc countries, which were previously planned economies.
(Source) World Bank, Dai-ichi Life Research Institute.
Figure 2 illustrates global inflation rates since 1980, with the band representing the range between the maximum and minimum inflation rates after excluding the top and bottom 10% of countries. Following the end of the Cold War in 1989, global inflation declined amidst globalization, indicating a decrease in the rate of increase. Also, except for the period immediately after the Cold War's conclusion, the range between maximum and minimum values has been narrowing since the 1990s. It can be interpreted that free trade and globalization facilitated a smoother global supply-demand matching of "people, goods, and capital," contributing to stabilizing inflation rates. However, if global economic fragmentation intensifies, adjustments between surplus and deficit countries would become difficult, potentially reversing this mechanism.
3. Fragmentation of People: Trends in International Migration
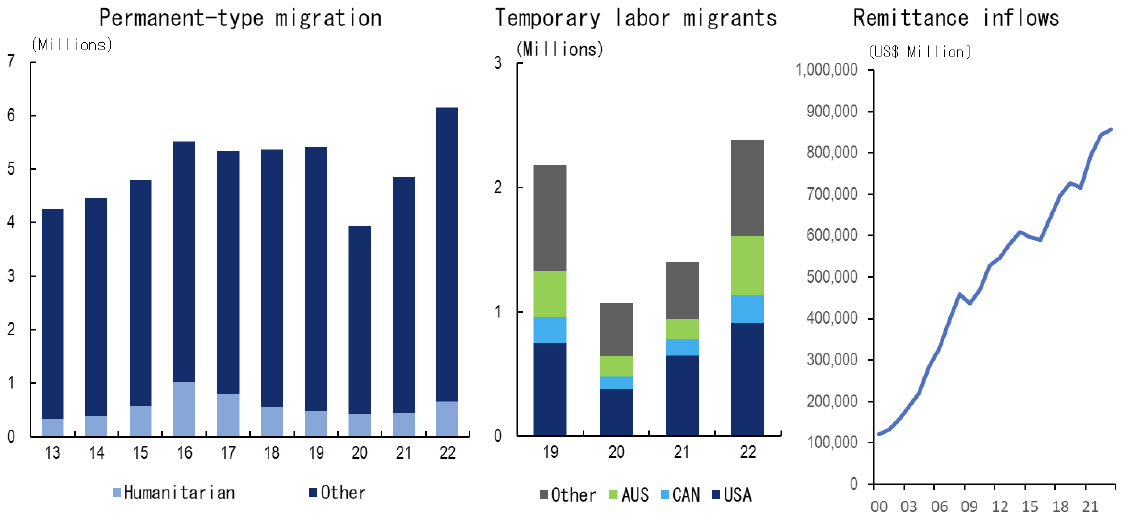
Increasing "anti-immigrant sentiment" is often cited as a contributing factor to the rise of far-right political parties globally. Conversely, this suggests a growing presence of immigrants, particularly in societies experiencing social friction. In OECD countries, while the number of immigrants (permanent) decreased significantly in 2020 due to the global COVID-19 pandemic, it rebounded to 6.14 million in 2022, marking a return to the long-term upward trend. Additionally, temporary migrant workers, including those in seasonal agriculture work and individuals on working holiday visas, also recovered clearly. Overall, this indicates a normalization in international migration following the pandemic. During this time, individual remittances have continued their upward trend since 2000, driven by increased money transfers from immigrants to their home countries.
This medium-term expansion in immigration is largely due to labor supply-demand imbalances across regions. Developed countries face a structural shortage of workers in sectors such as accommodation and food services and construction. Meanwhile, wages in developing countries remain relatively low. Therefore, people from these countries are economically better off working as immigrants in developed nations. Although the COVID-19 pandemic's restrictions on international travel and the sharp drop in demand for workers in the service sector temporarily reduced immigration, post-pandemic, the labor supply-demand imbalance is again driving international migration.
Figure 3. Trends in New Immigrants and International Remittances in OECD Countries
(Source) Created by Dai-ichi Life Research Institute based on OECD's "International Migration Outlook 2023" and KNOMAD.
However, this broader trend varies among developed countries. In the US, built on immigration, legal immigration has been gradually declining since reaching its peak in 2016. This decline follows the Trump administration's immigration visa restrictions, primarily targeting Muslim-majority countries. Recovery has remained slow even under the Biden administration (we will address undocumented immigration later). In contrast, the EU witnessed increasing immigration before the pandemic, largely due to accepting refugees from the Middle East and North Africa.
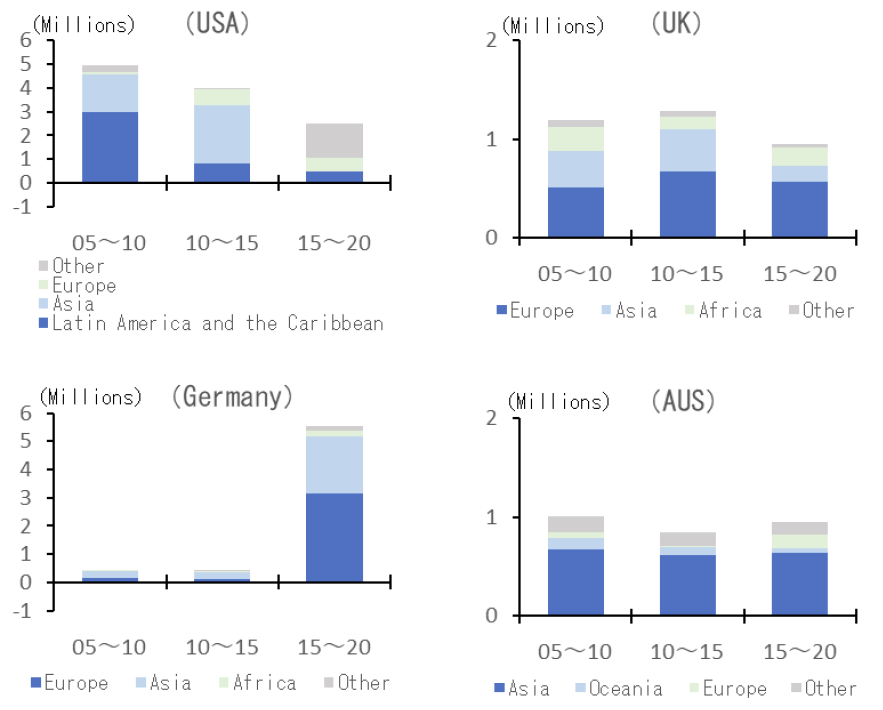
Further, immigration trends between specific countries and regions are influenced by political confrontations, particularly the US-China rivalry. Examining the net migration by region of origin every five years, Asian immigration to the US decreased from +2.47 million between 2010-2015 to -20,000 between 2015-2020. Conversely, Australia maintained its increasing trend, with +630,000 Asian immigrants during the latter period, consistent with the previous period (+620,000). Specifically analyzing Chinese immigrants by region, the number residing in the US decreased by 490,000 from 2015 to 2020, reversing the previous inflow of +750,000 and highlighting a shift away from the US potentially driven by the US-China rivalry. Meanwhile, Oceania witnessed a surge in Chinese immigrants, increasing from +150,000 to +200,000. These trends illustrate the impact of the escalating US-China conflict on the destination choices of Chinese migrants.
Figure 4. Net Migration by Region of Origin
(Source) Created by Dai-ichi Life Research Institute based on data from the United Nations.
Immigration flow trends are driven by various factors, including geographical elements, economic disparities with neighboring countries, and historical ties. Therefore, increased economic fragmentation does not necessarily reduce immigration, and it remains unclear if immigration policies always have their intended effect. As mentioned earlier, the rise in European immigration during the 2010s was largely influenced by instability in North Africa and the Middle East following the Arab Spring. Meanwhile, the US Biden administration faces continuous challenges managing undocumented immigrants at the US-Mexico border. A major factor driving this undocumented immigration is the economic gap between the "robust US economy" and the "struggling economies of Central and South American countries.” Relying solely on strict border control may not sufficiently curb immigration.
Therefore, to predict future immigration trends, we must consider not only the policies of host countries shaped by rising anti-immigrant sentiments but also the economic conditions and social situations in migrants' origin countries (primarily developing countries).
Currently, there is no sign that the labor supply-demand imbalances underpinning immigration will disappear. Developed countries, facing increasingly aging populations, need population growth through immigration to address labor shortages and ensure the sustainability of social security systems. While some developed countries are shifting away from lenient immigration policies in the current environment of global fragmentation, implementing stricter immigration control measures will further highlight economic challenges like labor shortages. Regarding the migrant-sending countries and regions, while the global economy is projected to maintain steady growth, led by countries like India, this growth is not evenly distributed. It is highly probable that people from countries with relatively lower economic standards will remain motivated to migrate to developed nations.
However, if social friction stemming from immigration persists, stricter measures may be implemented. For instance, in Europe, high unemployment rates among immigrants due to slow social integration could exacerbate concerns about public safety and increased financial burdens, potentially outweighing the positive view of the economic benefits of immigration. The combination of a less welcoming social climate towards immigrants and stricter immigration policies may significantly diminish the advantages of migrating from developing to developed countries. Furthermore, some anti-immigrant sentiment may stem not from accurate information or proper data analysis, but rather from prejudice against immigrants and dissatisfaction with economic inequality in developed countries. Consequently, there is a risk that as multiple countries adopt anti-immigration policies, a global trend of restricting immigration may emerge.
Figure 5. Population Growth and Aging Rates in Major Countries

(Note): Demographic old-age to working-age ratio = Population aged 65 and over / Population aged 20-64 * 100.
(Source) Created by Dai-ichi Life Research Institute based on OECD's "International Migration Outlook 2023" and "Pensions at a Glance 2023."
4. Fragmentation of Goods: Trends in Trade
Next, let's examine the current state of fragmentation in "goods," or trade, using data. Figure 6 presents the trends in global imports (trade volume) since 2000. This period can be broadly divided into three phases:
- (1) Globalization Phase: Beginning with China's accession to the WTO, this phase saw significant growth in global trade volume.
- (2) Slow Trade Phase: Following the 2008 Global Financial Crisis (GFC), the growth in global trade slowed considerably. This slow trade trend can be attributed to:
- 1. Weaker global demand due to deteriorated balance sheets.
- 2. Structural changes in demand, including an increase in domestic production within China.
- (3) US-China Conflict Phase: Beginning with President Trump's inauguration in 2017, this phase is marked by increased trade tensions between the US and China. The Trump administration prioritized protecting domestic industries and expanding employment, implementing an "America First" policy of raising tariffs, mainly targeting Chinese goods. While the current Biden administration has moderated this stance slightly, the framework for tariffs on Chinese goods remains.
Figure 6. Global Imports
(Source) Created by Dai-ichi Life Research Institute based on CPB data.
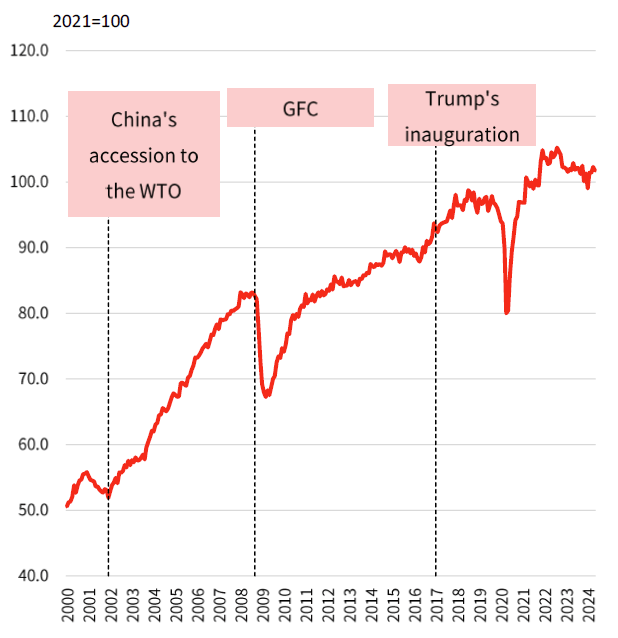
Discerning clear trends in trade volume amidst the COVID-19 pandemic is challenging. However, following the recovery from the pandemic and as supply chains are restored, trade appears to be reverting to the slow trade phase trend. Figure 7 shows the US trade deficit with China. In 2023, this deficit was at its smallest in 14 years, indicating a contraction in US-China trade. This data makes it evident that the US-China rivalry is steadily impacting trade.
Figure 7. US Trade Balance with China
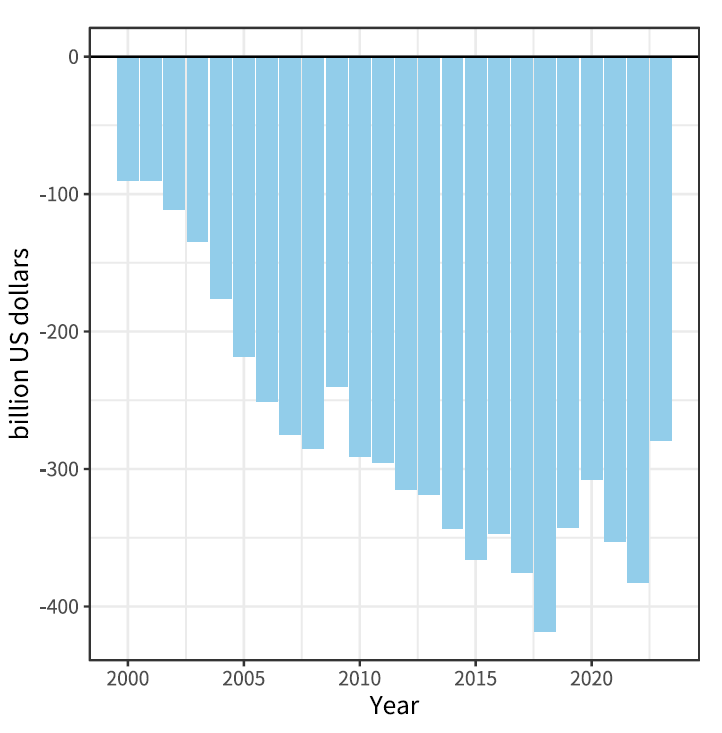
(Source) Created by Dai-ichi Life Research Institute based on IMF data.
While trade stagnates between economic powerhouses, the US and China, Global South countries are becoming more influential. Using the IMF's "Direction of Trade Statistics," Figure 8 examines the trade trends (share of trade between countries/regions in global trade value each year) by exporter and importer for major countries and regions. As previously seen, exports from China to the US are trending downwards. Meanwhile, trade flows from the Global South to the US, from the Global South to China, and from China to the Global South are increasing their share of global trade, particularly driven by Southeast Asia's expanding share.
Figure 8. Share of Trade Value in Global Trade by Exporter/Importer
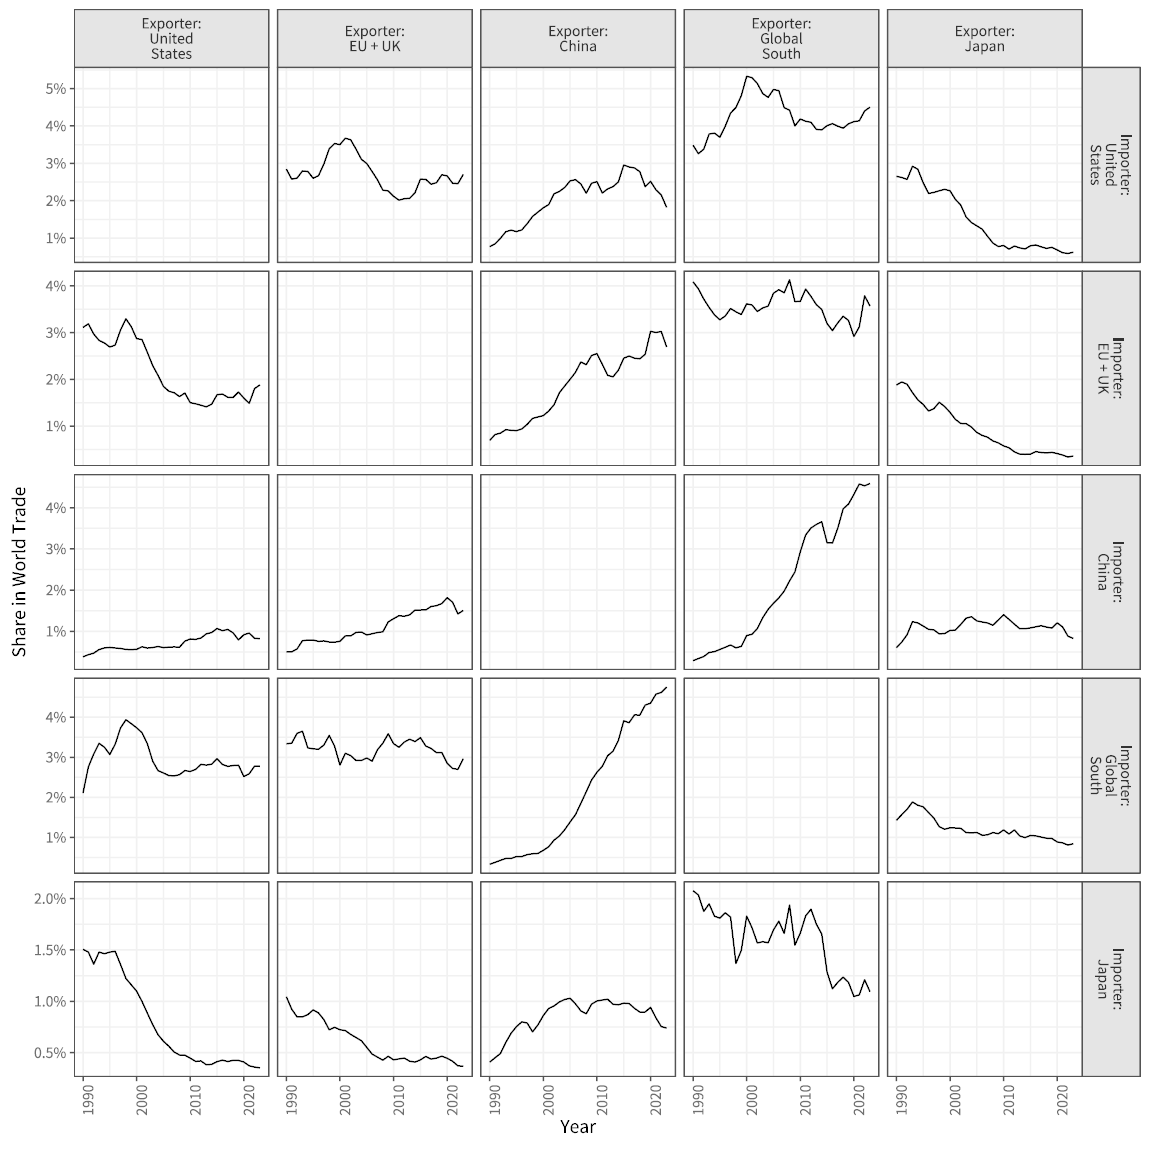
(Note) Global South (GS) classification excludes China and follows the Finance Center for South-South Cooperation categorization. This category includes emerging and developing economies like India, Southeast Asia, the Middle East, Latin America, and Africa.
(Source) Created by Dai-ichi Life Research Institute based on data from the IMF's "Direction of Trade Statistics."
This trend suggests that in the context of the US-China rivalry, Global South nations with higher growth potential are becoming more important as both exporters and importers. However, this increase in their trade share may be partially attributed to "transshipment trade." For instance, as trade between China and the US declines, goods are increasingly routed through a third country, like Mexico (China → Mexico → US), potentially to circumvent tariffs. Indeed, Mexico overtook China as the top source of US imports in 2023. While this signifies increasing redundancy and inefficiency in supply chains due to tariffs, it also implies that trade between the US and China has not been entirely severed by protectionist policies. In any case, as the US-China rivalry influences trade flows, Global South nations are gaining influence as both demand and supply sources and as transshipment hubs, potentially softening the adverse effects of the US-China decoupling.
To understand the recent shifts in global supply chains and whether fragmentation is occurring between liberal and non-liberal economies, we analyzed the degree of foreign dependence in manufacturing supply chains. This analysis used the International Input-Output Tables published by the ADB (Figure 9, with data up to 2022). We investigated how countries, categorized by their level of freedom as defined by Freedom House (Free, Partly Free, Not Free), were deepening their ties within specific supply chains.
Figure 9. Degree of Foreign Dependence in Manufacturing Supply Chains
by Country's Freedom Status

(Note) This value is calculated as the input amount from overseas divided by the total input amount, including domestic input. The boxes in each graph show the degree of freedom of the country of origin, and the colours of the line graphs show the degree of freedom of the country of input.
(Source) Created by Dai-ichi Life Research Institute based on data from ADB and Freedom House.
The analysis highlights a clear trend: "Free" countries are strengthening their dependence on other "Free" nations, demonstrating a move towards reinforcing supply chains amongst liberal democracies. However, this does not necessarily translate to a decreased reliance on "Not Free" countries. Instead, the dependence of "Free" nations on "Not Free" countries seems to be on an upward trajectory. This pattern is mirrored in the dependence of "Partly Free" countries on "Not Free" nations.
This suggests that the current reshaping of supply chains is not a straightforward "decoupling" of liberal and non-liberal economies. Instead, it reflects a "diversification" strategy, where liberal countries, while increasing their ties with other liberal countries, are also maintaining their existing relationships with non-liberal countries. This implies that businesses, though conscious of geopolitical risks, still prioritize efficiency and economic factors in their supply chain structuring.
5. Fragmentation of Capital: Trends in Capital Flows
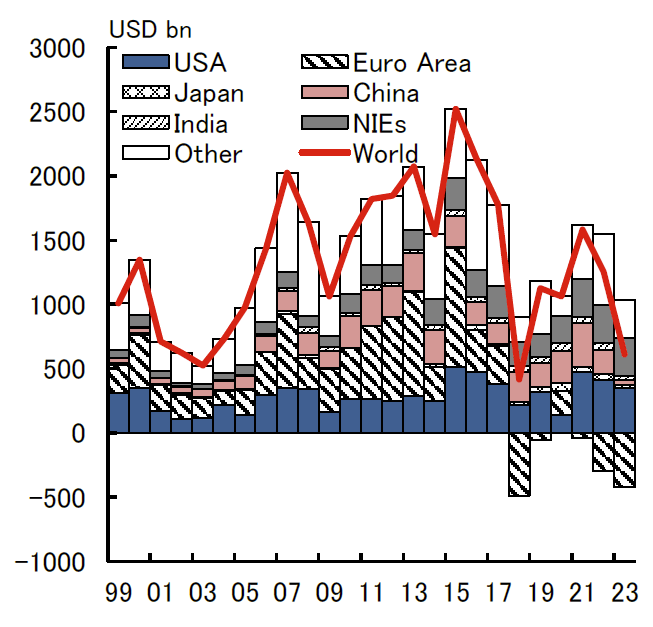
Finally, we examine the current state of fragmentation of "capital", from investment flows. Observing global capital flow trends, we see a contraction since the GFC, particularly in direct investment recently (Figure 10). This trend can be attributed to the post-GFC increase in risk aversion, the strengthening of regulations, and the recent rise in geopolitical tensions. Examining specific countries and regions, the US receives the most significant capital inflow, accounting for approximately 48% of the global total. This concentration of capital inflow highlights the position of the US dollar as a base currency and the relative strength of the US economy.
Figure 10. Global Capital Flows
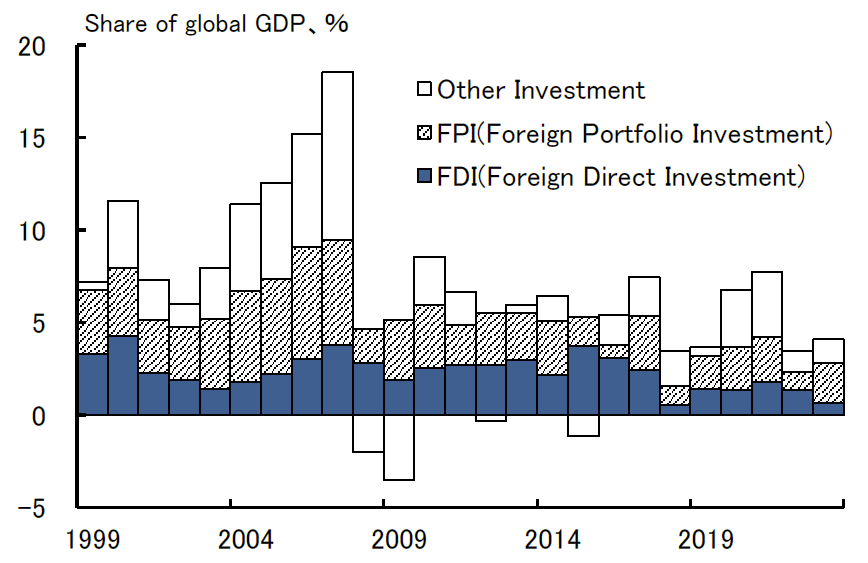
(Note) Capital flows from the debt side.
(Source) Created by Dai-ichi Life Research Institute based on data from Macrobond
Analyzing trends by type of capital flow, portfolio investment has predominantly flowed into the US, a trend observed even before the GFC (Figure 11). Although some emerging countries have implemented capital inflow regulations to stabilize their financial markets, capital regulations on portfolio investment are looser compared to those on direct investment. There are currently no visible signs of fragmentation in portfolio investments. This suggests that globalization within portfolio investment is still going on. Investors, while considering geopolitical risks, persist in cross-border investments to capture profit opportunities.
Figure 11. FPI Inflows
(Source) Created by Dai-ichi Life Research Institute based on data from Macrobond
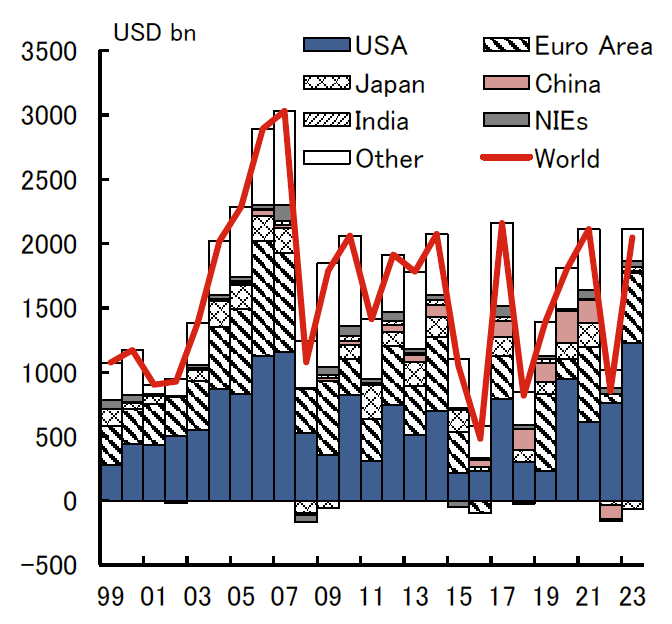
FDI, on the other hand, has been on a downward trend since 2016 due to rising geopolitical tensions, such as trade frictions between the U.S. and China, and protectionist policies in response to these tensions. This decline is particularly prominent in the Eurozone, which has experienced sluggish economic growth recently. However, unlike portfolio investment, FDI is not solely concentrated in the US. Diversity exists in investment destinations, including Asian countries (Figure 12).
Figure 12. FDI Inflows
(Source) Created by Dai-ichi Life Research Institute based on data from Macrobond
Examining the US financial market's positioning, we calculated Lane et al. (2007) financial market globalization index (sum of gross stocks of financial assets and liabilities over GDP)[1] (Figure 13). The US shows a faster-than-average globalization rate for portfolio investment compared to the global average. However, FDI remains below the global average.
This suggests that the US is not the only viable market for FDI. With alternative investment destinations available, there is potential for a greater degree of fragmentation in FDI than in portfolio investment, contingent on future regulations.
Indeed, against a backdrop of heightened economic security concerns, regulations surrounding FDI are becoming stricter. For instance, the US has strengthened the authority of the Committee on Foreign Investment in the United States (CFIUS). In 2024, Europe revised its FDI screening regulations, making the previously optional FDI screening process mandatory for member states. India, which previously required government approval for investments from Bangladesh and Pakistan, expanded this requirement through a legal amendment in 2020 to include all "countries sharing a land border with India," which includes China. There is a clear trend of strengthening regulations targeting specific countries (China and Russia) and industries (semiconductors, information and communications technology, specialized, scientific and technical services, energy, etc.). While these regulations are intended to protect national security and prevent technology leaks, excessive tightening could adversely impact the global investment environment and potentially contribute to further economic fragmentation.
Figure 13. Globalization Index of Financial Markets
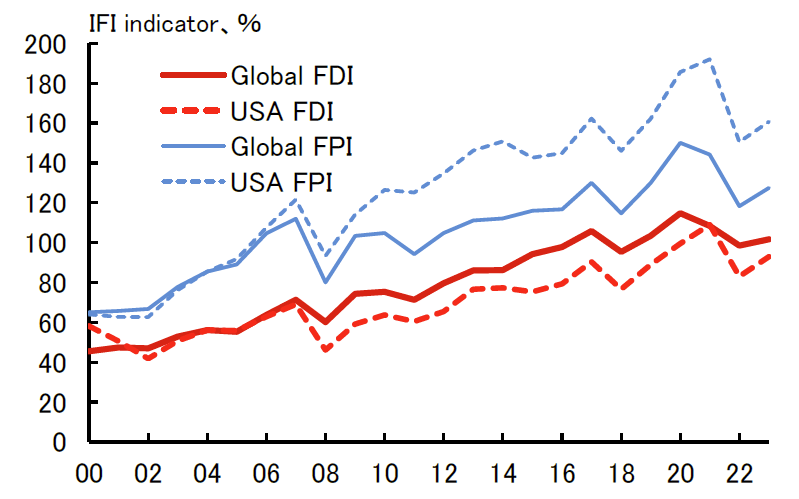
(Source) Created by Dai-ichi Life Research Institute based on data from Macrobond
So, in the end, is fragmentation in direct investment already underway? When examining the trends in investment destinations by country/region (Figure 14), we see that the proportion of investments between the US and Europe is either increasing or remaining high. However, the US investment in China is declining, while investments in the Global South are trending upwards. Additionally, there is a noticeable decrease in investment flows from China to the US.
Therefore, rather than concluding that "fragmentation is progressing and FDI is forming blocs," it is more accurate to state that "the destination of US capital is shifting from China to the Global South." Fragmentation, at this stage, appears limited. However, it is crucial to note that, due to data limitations, this analysis only covers overall FDI trends. If we analyze specific industries, sectors susceptible to investment regulations may already be experiencing accelerated fragmentation and bloc formation.
Figure 14. Changes in Investment Destinations

(Note) Global South (GS) classification excludes China and follows the Finance Center for South-South Cooperation categorization. This category includes emerging and developing economies like India, Southeast Asia, the Middle East, Latin America, and Africa.
(Source) Created by Dai-ichi Life Research Institute based on data from the IMF's "The Coordinated Direct Investment Survey."
6. Conclusion: The Current State of Global Economic Fragmentation
This report analyzed the current state of global economic fragmentation from three perspectives: "people," "goods," and "capital," using data analysis.
First, there has been a clear shift in the flows of people, goods, and capital between the world's two largest economies, the US and China. Under the protectionist policies implemented during the Trump era and continued under the Biden administration, immigration, trade, and investment between these two countries have continued to decrease.
Second, there are alternative movements compensating for this decline. Global South countries are increasing their presence as destinations for trade and investment. Additionally, more people are immigrating from China to Australia and Europe. While these alternative flows, including transshipment trade for tariff circumvention, contribute to inefficiencies in supply chains, they also serve as a buffer preventing complete fragmentation. Therefore, while the US-China decoupling is at the forefront of global economic
Table 1: The Current State of Global Economic Fragmentation
Globalization Period (primarily the 2000s): Free trade, expansion of global supply chains to emerging economies, increased migration driven by economic benefits, global expansion of direct investment, free capital movement with high investment efficiency.
Current State: US-China-centric protectionist policies, focus on domestic production for economic security, diversification and inefficiency in global supply chains (including transshipment for tariff circumvention), stagnation of people's movement between US-China, some countries/regions reconsidering immigration expansion, FDI regulations targeting specific countries/industries.
Severe Fragmentation: Spread of protectionist policies beyond US-China, division of global supply chains between liberal/non-liberal countries, intensified labor shortages in developed nations due to anti-immigration sentiment and strict policies, widespread implementation of FDI regulations and bloc formation, increase in inefficient investment.
Created by Dai-ichi Life Research Institute.
The crucial question is whether this economic fragmentation will advance to the next stage. Currently, although the US-China decoupling is occurring, other countries are mitigating its impact. We are still distant from a "severe fragmentation" scenario where there is a complete division between liberal/non-liberal blocs, including in supply chains and investments. Additionally, many countries are exercising restraint in their protectionist measures to avoid significantly impacting their own economies.
However, there is a risk of severe consequences for the global economy if nationalism intensifies to the point where countries disregard the economic repercussions. For example, if the current anti-immigration trend expands beyond a few countries and impacts nations globally, or if supply chain and investment activities split between liberal and non-liberal countries, adjusting production resource allocation will become even more challenging, significantly impacting global economic growth and inflation rates.
While the deglobalization trend of recent years has been somewhat mitigated by third countries, it is still in its nascent stages. The upcoming US presidential election will be critical in this regard. If former President Trump, advocating for stricter tariffs on many countries, is elected and protectionist trends escalate, global economic fragmentation could enter a new, more impactful phase.
[1] Lane, P. and G-M. Milesi-Ferretti [2007], “The External Wealth of Nations Mark II: Revised and Extended Estimates of Foreign Assets and Liabilities, 1970–2004,” Journal of International Economics 73, 223–250.
Original in Japanese:
https://www.dlri.co.jp/report/macro/385028.html
Disclaimer:
This report has been prepared for general information purposes only and is not intended to solicit investment. It is based on information that, at the time of preparation, was deemed credible by Daiichi Life Research Institute, but it accepts no responsibility for its accuracy or completeness. Forecasts are subject to change without notice. In addition, the information provided may not always be consistent with the investment policies, etc. of Daiichi Life or its affiliates.